Turn Questions into Dashboards, Instinctively
Ask in plain English. Combine your data with live web insights. Get a fully interactive dashboard in seconds.
Transform
scattered
data
into
smart
dashboards
Data Sources
Excel
CSV
CSV
Web links (coming soon)
Multiple Data Sources
Bring your own data—from Excel, CSV, APIs, or links (coming soon)—and unify it in one dashboard.
Work Hour Analysis
Details

Monday, 6h
Real-Time Insights
Visualizations that evolve as your data or the web does. Stay current, always.


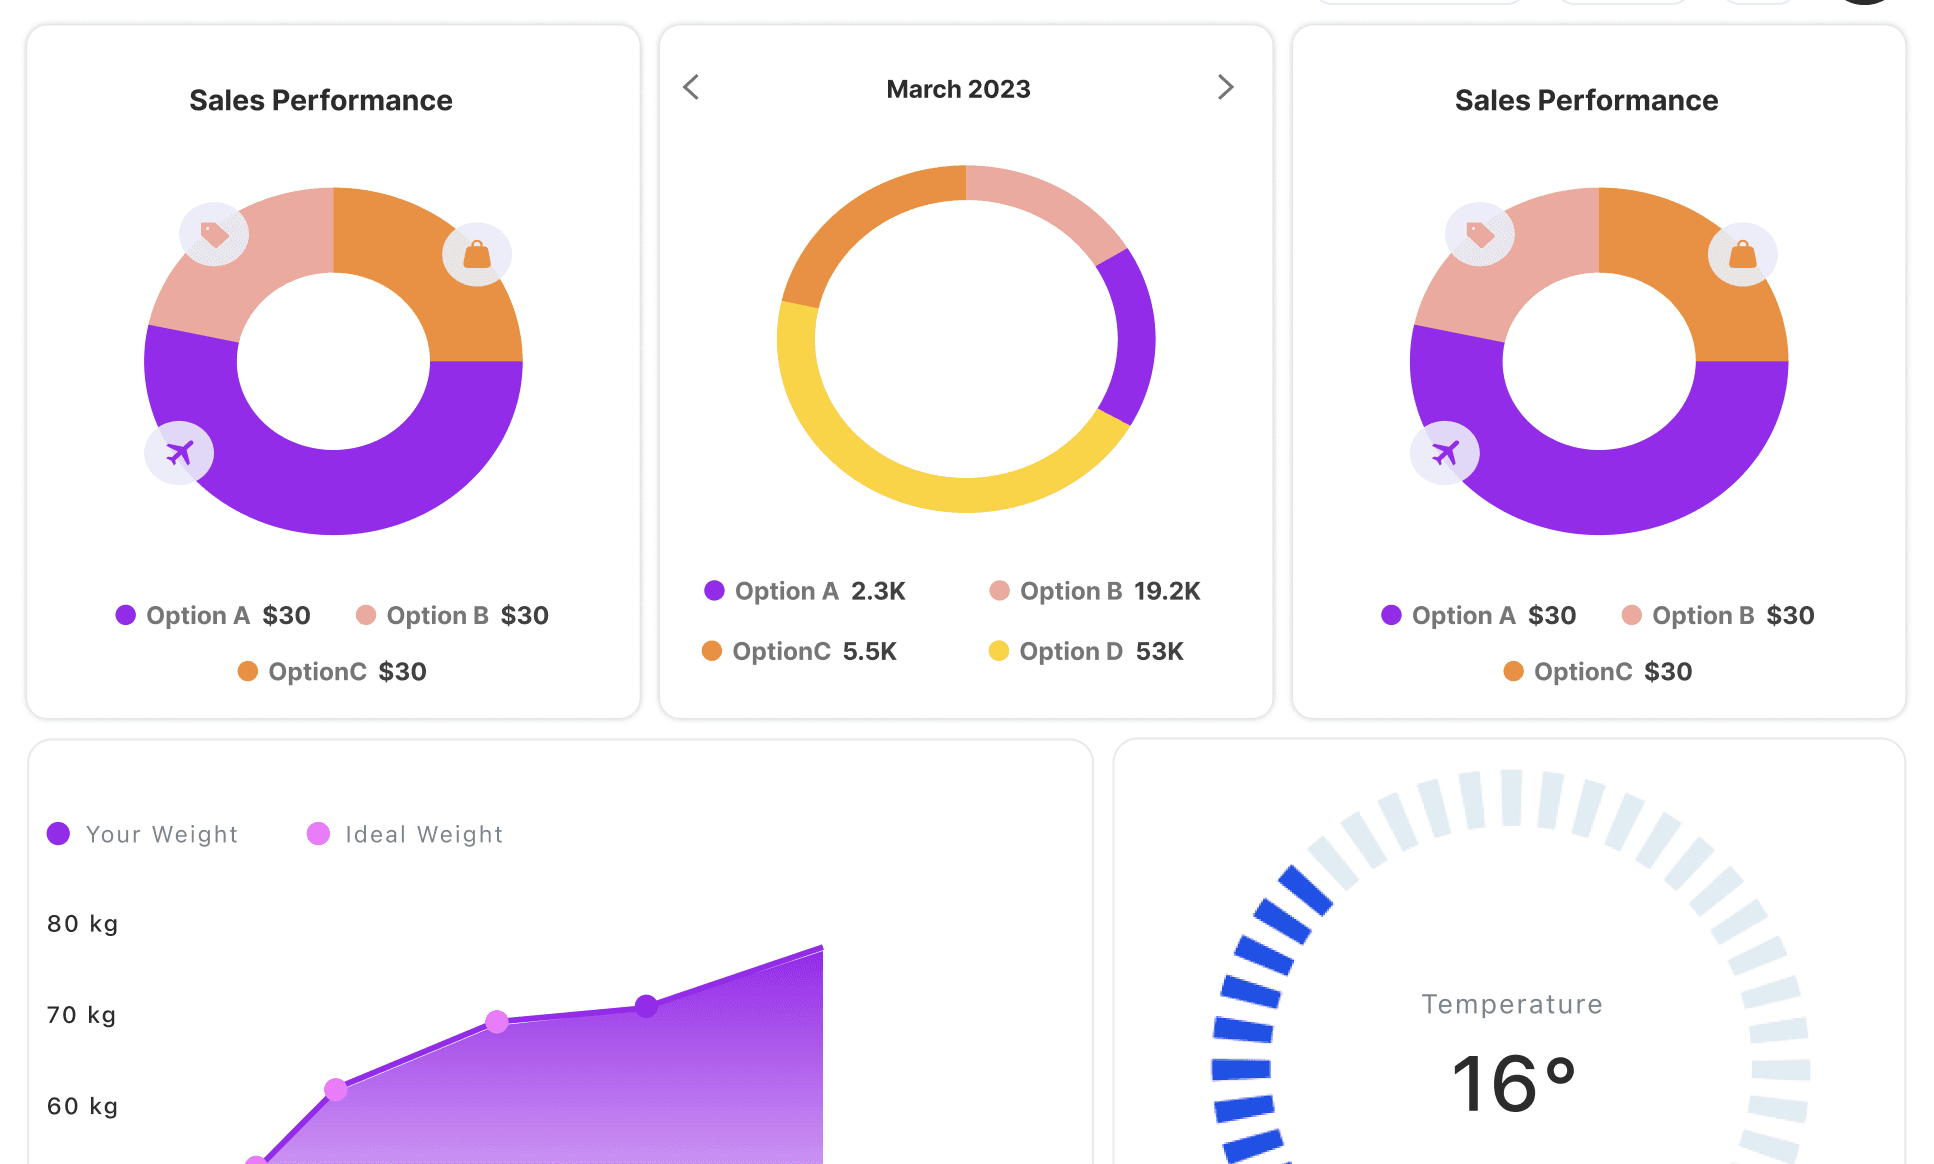
Customize Everything
Fine-tune colors, layout, and widgets. Make dashboards that feel like yours.
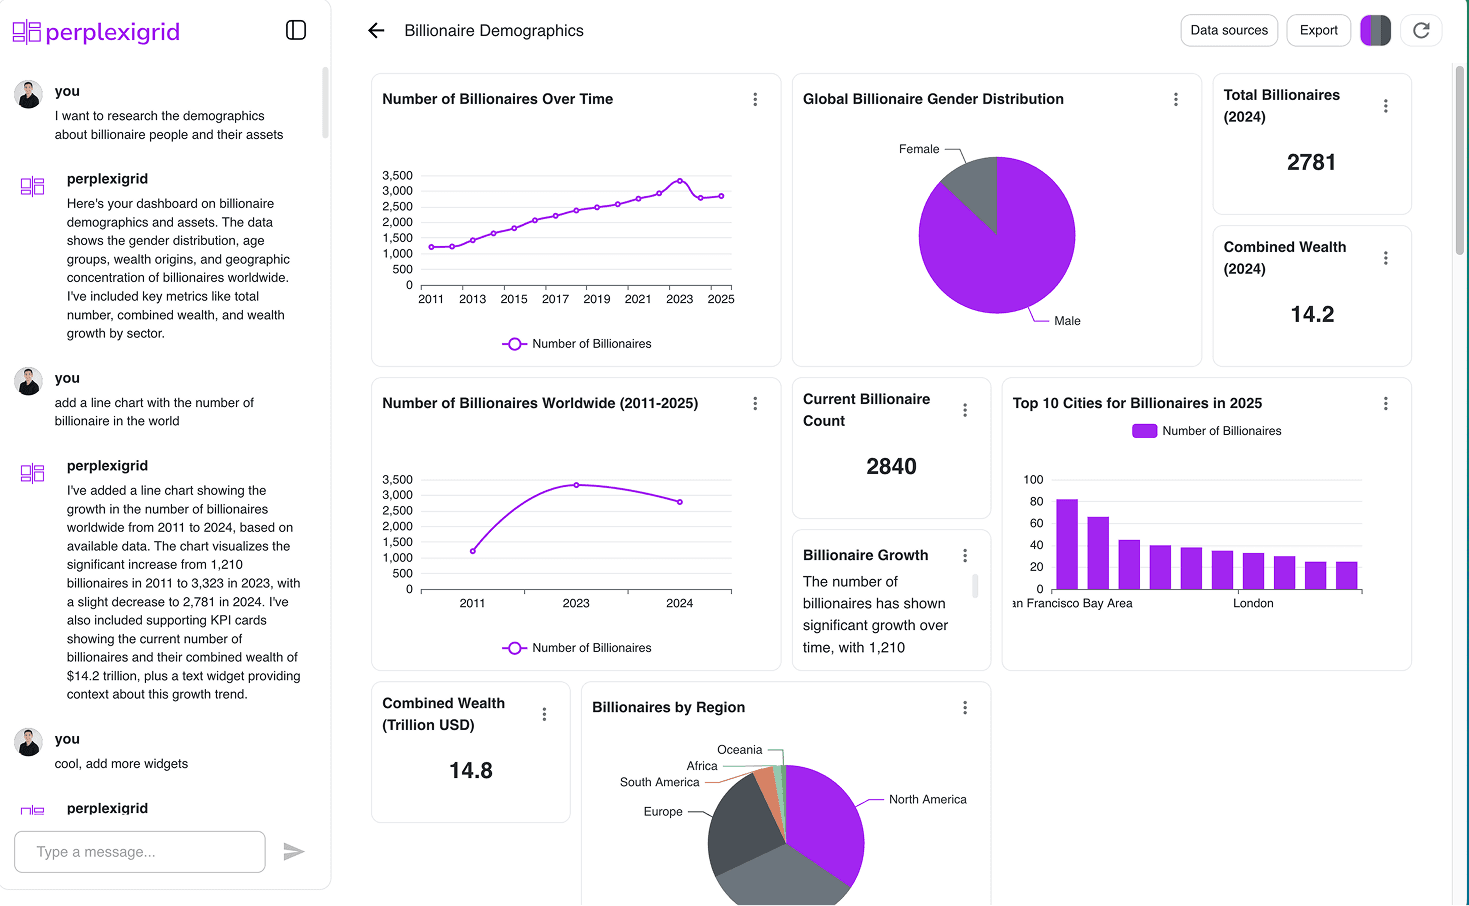
Generate

Generate in One Click
Ask your question, and perplexigrid instantly builds a dashboard tailored to your prompt.
Collaborate in Real Time (coming soon)
Build dashboards together in a shared workspace—just like chatting with your team.
Features
Powerful features designed for fast, flexible analytics
Pricing
Choose the perfect pricing plan to match


How it works
Your path to insights—fast, simple, seamless
Step-01
Create your account
Sign up and connect your data sources in minutes. No setup headaches—just insights, fast.

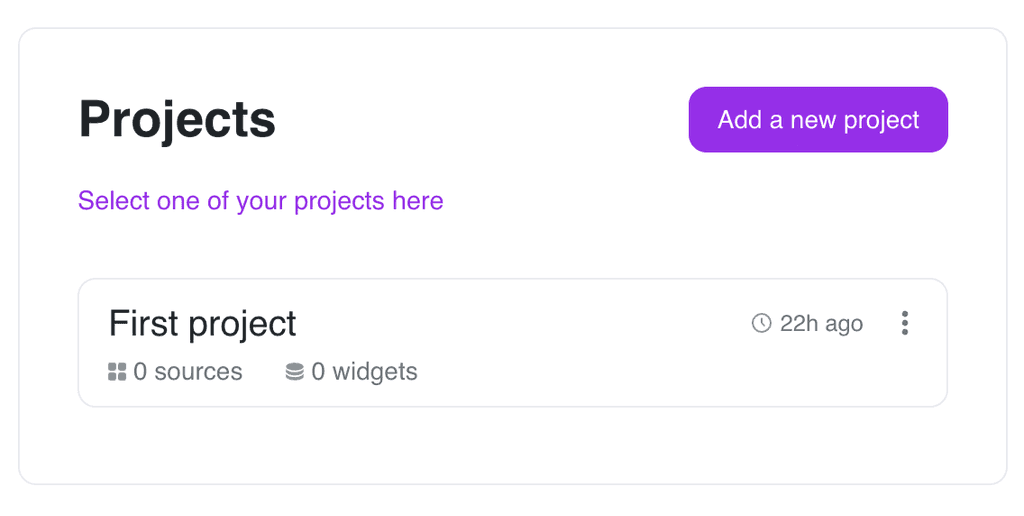
Step-02
Start a New Project
Kick off a dashboard with a simple prompt. Organize everything in a project space designed for clarity.
Step-03
Add Your Data
Upload CSVs, Excel files, or connect other sources. Blend them with live web data for richer context.

Step-04
Customize Your Dashboard
Refine layout, colors, and widgets. Drag, drop, or prompt PerplexiGrid to adjust exactly what you need.
